I’ve been on the Suffolk coast, in an attempt to get some book written. (It worked! Ish.) East Anglia, as anyone who’s been there or indeed ever looked at a map of it will know, is vast and empty, perhaps 1.5 million people in an area bigger than New Jersey. When your second biggest settlement is Ipswich, you know you’re not dealing with a heavily urbanised area.
It wasn’t always that way, though. Let’s take a trip into TNO(NQ)E archives…
One odd side effect of the fact I’ve been writing about cities for an extremely long time now is that I have a pretty instinctive grasp of the rankings of England’s cities by size. I know, without having to look it up, that Manchester and Birmingham are pretty much the same size and which comes out on top depends on how you count; I know that Liverpool, Bristol and Newcastle are in the next weight class down, but that Norwich and York are not.
And so I find it weirdly fascinating how few of England’s big cities were particularly important before the Industrial Revolution kicked in. London seems to have topped the rankings since about three days after the Romans arrived; Bristol and Newcastle sometimes pop up in the top 10, too. But of today’s other big cities? There’s no sign.
If you want to know where the great cities of England in the distant past actually were, there’s a very helpful Wikipedia page, which pulls together assorted data sources. Our story starts with the Normans, who were the first people to try to pin down the numbers. This is a shame as a list of the largest cities of Roman England would be fascinating, as would some hint of exactly which towns were pretty much raised to the ground following the Conquest – but, hey, you work with what you’ve got.
1086
1. London – 10,000+
2. Winchester – 6,000
3. York – 5,000
4. Norwich – 5,000
5. Lincoln – 5,000
6. Thetford – 4,000
7. Oxford – 3,000
8. Ipswich – 3,000
These figures mostly come from the Domesday Book, the survey of England the invaders conducted in 1086 so that William the Conquerer and/or Bastard [delete to taste] could see exactly what he’d just conquered. That actually consists of two different surveys: Little Domesday, a very detailed one covering Essex and East Anglia, and Great Domesday, which covers the rest of the country but in less detail, presumably because somebody, somewhere, realised quite how big a pain it was going to be to count every pig in the land just so some French-speaking Viking bloke could tax it.
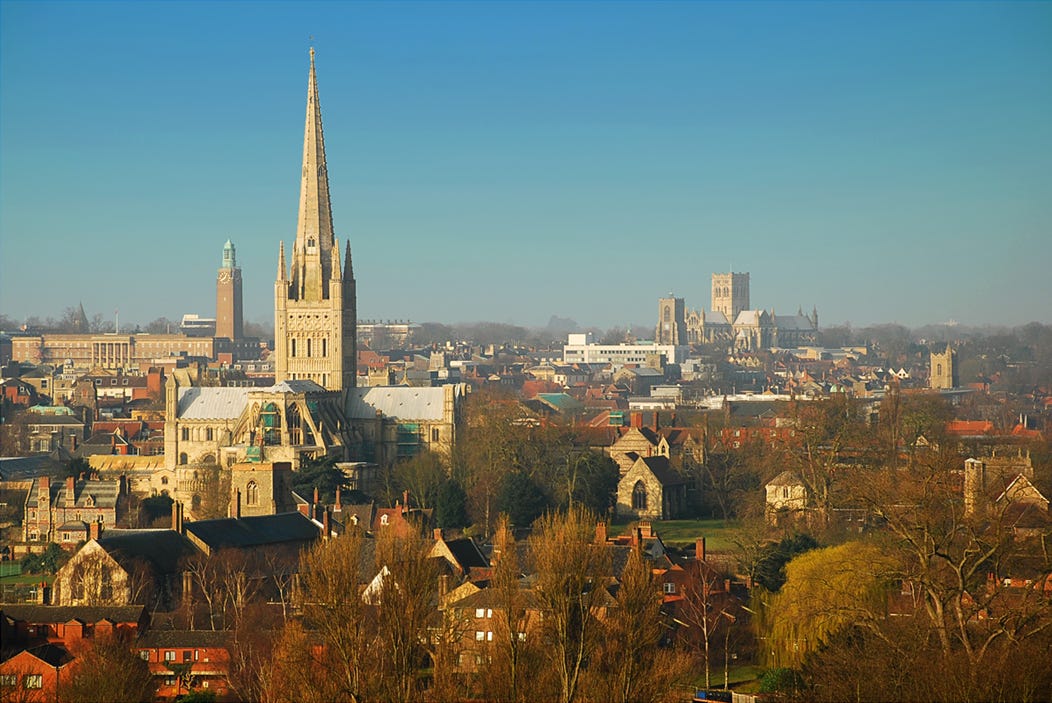
Norwich, medieval boom town. Image: Andrew Hurley/Wikimedia Commons/CC-BY SA 2.0.
There are some problems with using Domesday to work out urban populations. One is that many of the biggest settlements (London, Winchester, Tamworth) were excluded, probably because they had special tax exemptions that made them not worth surveying: London and Winchester are often said to have been the two largest cities in 11th century England, but whoever compiled this list has estimated their populations. Another problem is that the Domesday books count houses or “burgesses” (basically, relatively well-to-do urban taxpayers) rather than actual people. It’s not clear how much guess work has gone into these figures or, come to that, exactly who is doing the guessing.
But there are a few interesting things about them nonetheless. One is that the largest city after London is Winchester, the capital of the ancient anglo saxon kingdom of Wessex, which pretty much created England by conquering it from the Vikings. The next few are divided among the major Anglo-Saxon kingdoms, too: York in Northumbria, Norwich in East Anglia, Lincoln in Mercia.
Let’s not get carried away with the idea that Norman England was a far less centralised country than today’s, however, because – York excepted – none of these cities are in the north. That may be because the north wasn’t properly surveyed by Domesday, because it was not yet fully integrated into England; then again, it may be because the Normans had recently spent quite a lot of time setting fire to much of it in the event known to history as the Harrying of the North.
So most of the biggest, most developed cities listed here were in the south east or close to the east coast. Bubbling under this list, also with an estimated population of around 3,000, is Dunwich, the northern Suffolk port town which had once been the East Anglian capital, but which would spend the next few centuries gradually falling into the sea. By 2011, it had a population of just 183.
1377
1. London – 23,314
2. York – 7,248
3. Bristol – 6,345
4. Coventry – 4,817
5. Norwich – 3,952
6. Lincoln – 3,569
7. Salisbury – 3,226
8. King’s Lynn – 3,217
9. Colchester – 2,955
10. Boston – 2,871
11. Beverley – 2,663
12. Newcastle – 2,647
13. Canterbury – 2,574
14. Bury St Edmunds – 2,445
15. Oxford – 2,357
These curiously specific figures are taken from a history book called Local History in England, by W. G. Hoskins. The reason we suddenly have numbers is because 1377 was the year of the first poll tax, a set fee charged on everyone over the age of 14. This was bad news for the medieval public, and also frankly for the ruling class which, within four years, would be dealing with the Peasants’ Revolt; but it’s good news for demographers and anyone else trying to track the growth of England’s cities seven and a half centuries after the event. (Mind you, since the resulting data still requires those compiling the figures to guess what share of the population was under the age of 14 we probably shouldn’t take the numbers too literally.)
Anyway: York and London continue to thrive. Regional centres of trade, like Coventry and Salisbury, put in their first appearance (the former is still a pretty big city, albeit one in the shadow of its much bigger north western neighbour Birmingham; the latter, even charitably, is not). So do a number of major ports, including two – Bristol and Newcastle – that remain major centres today. Winchester, though, has shrunk, and plummeted down the rankings to around 30th, as political and economic power moved definitively to the capital.
The big story, though – even more than in 1086 – is one of eastern dominance. East Anglia – which combines good farmland with easy access to European markets – does particularly well for thriving market towns (Norwich, Colchester, Bury St Edmunds).
This pattern is even more visible when you get to the 16th century. No population figures this time, presumably because Henry VIII had enough on his plate without sparking another peasants revolt, and decided to liquidate some monasteries instead. But here are Hoskins’ rankings for the early Tudor period:
1523
1. London
2. Norwich
3. Bristol
4. Newcastle
5. Coventry
6. Exeter
7. Salisbury
8. Ipswich
9. King’s Lynn
10. Canterbury
11. Reading
12. Colchester
13. Bury St Edmunds
14. Lavenham
15. York
Lavenham? Where TF is Lavenham and how did it get to be bigger than York?
It is, it turns out, a village in Suffolk, between Ipswich and Bury St Edmunds. Keep working down the top 30 and you’ll also find Great Yarmouth, Hadleigh, Cambridge and Wisbech. It isn’t just that these places aren’t in the list of biggest cities today: some of them are really reaching to call themselves towns.
Why was the east of England so full of boom towns? The answer seems to be the wool trade, the sort of tech industry of the early modern era. Not only did the eastern counties offer great pasture, they also provided easy access to the international markets of the Low Countries and beyond.
By the time of the first census, though, a host of other factors have begun to matter more than “quick access to a boat to Antwerp”, and the list of largest cities is beginning to look a lot more familiar:
1801
1. London – 959,000
2. Manchester – 90,000
3. Liverpool – 80,000
4. Birmingham – 74,000
5. Bristol – 64,000
6. Leeds – 53,000
Some time after that it gets complicated, and you have to start dealing with questions like, “Is the Black Country a part of Birmingham or not?” so I’m going to stop there.
Nonetheless, we talk a lot about the relative fortunes of north and south in this country. We rarely talk about the fact that the big story of the last half a millennium is the decline of East Anglia – and the way it failed to copy the success of the Netherlands.
Map of the Week
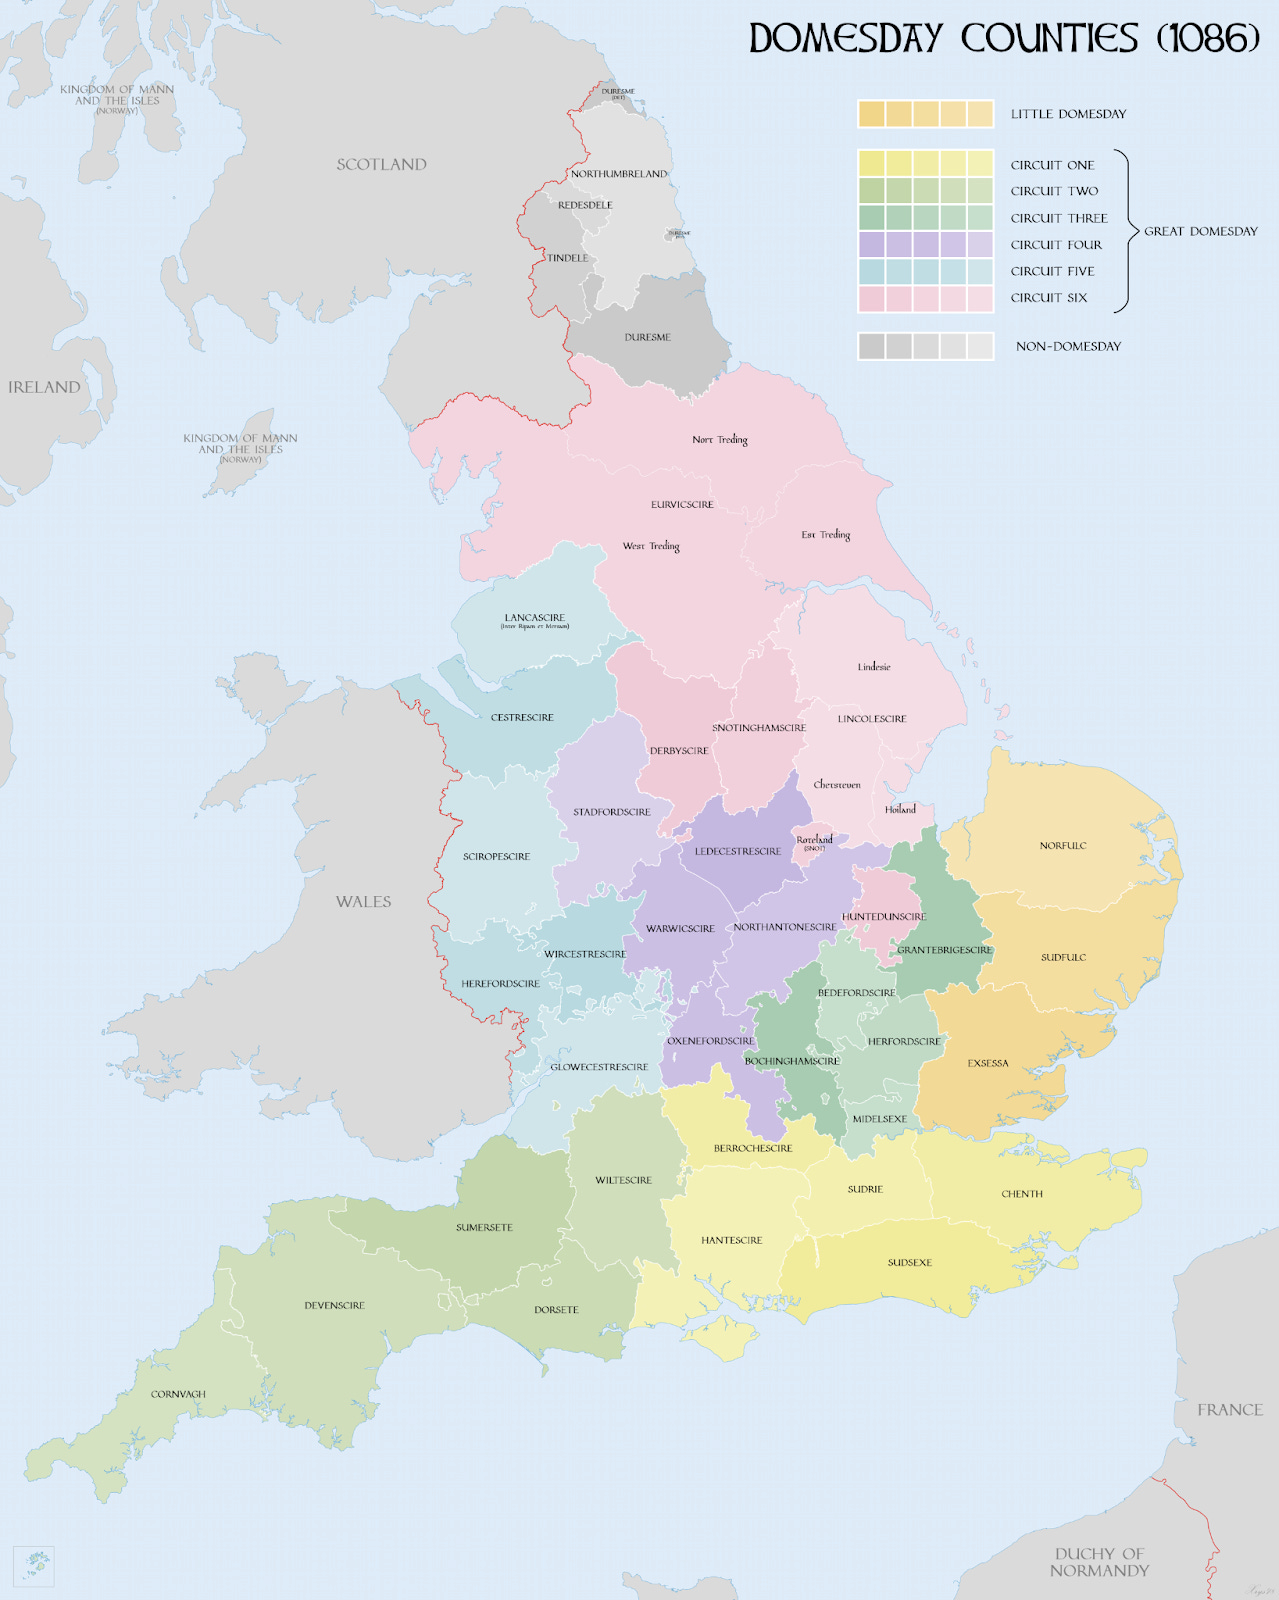
Sticking with this week’s theme: here’s a map of England at the time of the Domesday book.
Image: XrysD/Wikimedia Commons. Full size version here.
Loads to admire here. Top of the list must be the old English names of the counties (Excessa, Sudrie, Oxenefordscire and so forth). Nottingham had yet to lose its initial S, so its county here is still named Snotinghamscire.
Then there’s the fact that, in the north, the process of shiring is still half-finished. Cheshire (Cestrescire) includes a chunk of what is today Flintshire in north Wales; Yorkshire extends to the Irish Sea and covers much of what is today northern Lancashire. Lancashire itself is present but anachronistic: it wasn’t a county for another century, and the Domesday book referred to it instead as “Inter Ripam et Mersam”, the land between Ribble and Mersey, and counted its people alongside Cheshire. (The Lancascire of this map does not in fact include Lancaster.)
Then there’s Durham and Northumberland, so marginal that they weren’t included in Domesday at all. Durham was a palatinate, managed by the local bishops, and still included some detached parts of Northumberland; for its own part, Northumberland had yet to swallow neighbouring liberties of Tindale or Redesdale. Across the Pennines, what is today northern Cumbria was still then part of Scotland, a relic of the formerly Brittonic – that is, Welsh – speaking kingdom of Strathclyde.
Probably my favourite thing about this map, though, is further south, on the east coast. The Wash was rather bigger than it is now; while the coast of Lincolnshire was still protected by a series of barrier islands, believed lost during storms in the late Middle Ages.
I’m sure there are errors here I lack the knowledge to spot – it’s the internet, there always are. But there’s loads of interesting stuff I didn’t know here, and also, someone used their free time to make a map of England at the time of the Domesday Book. How cool is that?
Self-promotion corner
The article above is an expanded extract from the archive of the Newsletter of (Not Quite) Everything, a weekly newsletter which goes out every Wednesday at 4pm. If you enjoyed it, why not become a paying supporter? for a mere £4 a month or £40 a year, and every Wednesday afternoon you’ll get a bit on politics, some diverting links, an article on something from history/geography/language/whatever I’ve been obsessing about this week, and the map of the week. And for less than a pound a week, too! Click here to get started.
BUT: we’re all broke right now. If you can’t currently justify paying for some nerd’s substack (unemployed, underemployed, impoverished student, and so forth), just hit reply and I’ll give you a complimentary subscription, no questions asked. I am literally giving it away.
Or here are some things you can read:
"At least Monty Python’s four Yorkshiremen only bragged about how hard they’d had it. This lot do the same about what a terrible legacy they’ve handed on to their kids." My latest New Statesman column, on the Tory MPs who think you should stop whining and enjoy your gruel.
A lot of nonsense I’ve written about Doctor Who, which you can find here.


